Choosing Your Watchdog: An Introduction to Server Monitoring Tools like Nagios & Zabbix

In today’s digitally driven world, servers are the backbone of nearly every business operation. Ensuring their health, performance, and availability is paramount. This is where server monitoring tools come into play. Without effective monitoring, you’re essentially flying blind, unaware of potential issues until they cause outages or performance degradation, impacting users and potentially revenue. This guide introduces the concept of server monitoring and dives into two of the most established open-source players: Nagios and Zabbix.
What Exactly Are Server Monitoring Tools?
At their core, server monitoring tools are software applications designed to track and report on the status and performance of IT infrastructure components. This isn’t just about knowing if a server is “on” or “off.” Comprehensive monitoring involves observing a wide range of metrics, including:
- CPU Usage
- Memory (RAM) Consumption
- Disk I/O and Space
- Network Bandwidth and Latency
- Running Processes and Services (e.g., web server, database)
- System Logs
- Hardware Health (Temperature, Fan Speed – if supported)
These tools use various protocols like SNMP (Simple Network Management Protocol), ICMP (Internet Control Message Protocol), TCP checks, and often agents installed on the monitored systems to gather this data.
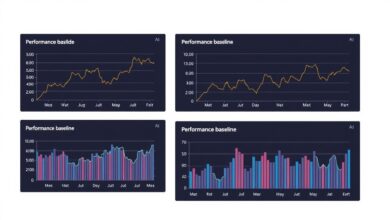
[Hint: Insert image/video of a typical server monitoring dashboard showing various metrics here]Why Proactive Monitoring is Non-Negotiable
Implementing robust server monitoring isn’t just a “nice-to-have”; it’s a fundamental aspect of modern IT management. The benefits are significant:
- Proactive Issue Detection: Identify and often resolve problems (like low disk space or high CPU load) *before* they impact end-users.
- Performance Optimization: Understand resource utilization patterns to pinpoint bottlenecks and optimize server configurations.
- Capacity Planning: Analyze trends over time to accurately predict future resource needs, preventing resource exhaustion.
- Improved Uptime & Reliability: Faster detection and resolution lead directly to higher service availability.
- SLA Compliance: Provide evidence of meeting Service Level Agreements regarding uptime and performance.
- Enhanced Security: Monitor for unusual activity or unauthorized changes that could indicate a security breach.
Spotlight on Open-Source Giants: Nagios and Zabbix
While the market offers numerous commercial and open-source server monitoring tools, Nagios and Zabbix have long been popular choices, particularly for organizations seeking powerful, customizable, and cost-effective solutions.
Nagios: The Veteran Monitor
Often considered one of the original standards in open-source monitoring, Nagios (specifically Nagios Core) is renowned for its flexibility and extensive plugin ecosystem. Its core strengths include:
- Maturity & Stability: A long history means it’s well-tested and reliable.
- Extensibility: Thousands of community-developed plugins allow you to monitor virtually anything.
- Powerful Alerting: Offers sophisticated notification logic and escalation paths.
However, Nagios Core traditionally relies heavily on manual text-based configuration files. This can present a steeper learning curve for newcomers. While commercial versions like Nagios XI offer a web interface and additional features, the free Core version requires more hands-on configuration expertise. Find more details on their official site Nagios Website.
[Hint: Insert image/video showcasing the Nagios interface or configuration example here]Zabbix: The All-in-One Enterprise Solution
Zabbix is often positioned as a more integrated, “enterprise-ready” open-source monitoring platform. Key advantages include:
- Web-Based Configuration: A comprehensive web UI simplifies setup, management, and visualization.
- Auto-Discovery: Can automatically find and start monitoring new devices on your network.
- Built-in Templating: Easily apply monitoring configurations across groups of similar hosts.
- Integrated Graphing & Reporting: Offers powerful data visualization capabilities out-of-the-box.
Zabbix’s all-inclusive approach often makes it easier for teams to get started compared to Nagios Core. It excels in large, complex environments and provides a wealth of features without necessarily relying on third-party additions for core functionality.
[Hint: Insert image/video showcasing the Zabbix dashboard or configuration interface here]Nagios vs. Zabbix: Understanding the Differences
While both are powerful server monitoring tools, the choice often comes down to specific needs and preferences:
- Configuration: Zabbix = Primarily Web UI; Nagios Core = Primarily Text Files (though UIs exist via add-ons or Nagios XI).
- Ease of Use: Zabbix is generally considered easier to set up initially due to its integrated web interface and auto-discovery. Nagios Core requires more manual effort but offers deep customization.
- Scope: Both cover core monitoring extensively. Zabbix includes many features (like graphing, mapping, web monitoring) natively, while Nagios Core often relies on plugins for similar functionality.
- Architecture: They differ in how they handle agents, proxies, and data storage, impacting scalability considerations for very large deployments.
Ultimately, both have strong communities and are capable of monitoring complex infrastructures effectively.
For further reading on system administration best practices, check out our related article: Essential SysAdmin Skills.
Choosing Your Monitoring Tool
Selecting the right server monitoring tool depends on your environment’s scale, your team’s technical expertise, specific feature requirements, and desired level of automation. Consider factors like:
- Do you prefer a web-based configuration or are you comfortable with config files?
- How important are features like auto-discovery and advanced built-in graphing?
- What is the size and complexity of the infrastructure you need to monitor?
- What level of community or commercial support do you require?
While this article focuses on Nagios and Zabbix, remember the landscape includes other powerful tools like Prometheus (popular for containerized environments), Icinga (a Nagios fork), and numerous SaaS solutions (e.g., Datadog, Dynatrace).
Conclusion: Monitor Smarter, Not Harder
Effective server monitoring is no longer optional; it’s essential for maintaining robust, reliable, and performant IT services. Open-source server monitoring tools like Nagios and Zabbix offer powerful capabilities for organizations of all sizes. By understanding their strengths, weaknesses, and core differences, you can make an informed decision and implement a monitoring strategy that keeps your critical systems running smoothly, proactively identifying issues before they escalate into major problems.