Unlock Peak Performance: A Practical Guide to Identifying Server Bottlenecks

Is your server sluggish? Are applications slow to respond? You might be facing a performance bottleneck. Effectively identifying server bottlenecks is the crucial first step in basic server performance tuning. Ignoring these hidden roadblocks can lead to frustrating user experiences, decreased productivity, and even costly downtime. This guide provides a practical approach to pinpointing what’s holding your server back.
Think of your server as a highway system. When one lane gets clogged (a bottleneck), the entire flow of traffic slows down. In server terms, a bottleneck occurs when a specific component—like the CPU, memory, disk I/O, or network connection—lacks the capacity or is misconfigured, thereby limiting the overall performance of the entire system.
Why Identifying Server Bottlenecks is Critical
Ignoring the signs of a bottleneck is like ignoring a check engine light. Initially, it might just be an annoyance, but it can quickly escalate. Unaddressed bottlenecks lead to:
- Slow Response Times: Web pages take ages to load, and application interactions feel sluggish.
- System Instability: Servers may crash or become unresponsive under load.
- Reduced Throughput: The server can handle fewer requests or process less data than expected.
- Increased Costs: Inefficient resource usage can lead to higher operational expenses, especially in cloud environments.
- Poor User Experience: Ultimately, slow performance drives users away.
Proactively identifying these issues allows you to optimize resource allocation, upgrade necessary components, or reconfigure settings before they cause major disruptions.
Common Symptoms of Server Bottlenecks
How do you know if you have a bottleneck? Keep an eye out for these common symptoms:
- Consistently high CPU utilization (often pegged at or near 100%).
- Excessive memory usage leading to swapping (using disk space as slow RAM).
- Long disk queue lengths or high disk latency (indicating storage can’t keep up with requests).
- Slow network transfer speeds, high latency, or significant packet loss.
- Application-specific errors or timeouts under load.
- System responsiveness degrading significantly during peak hours.
A Step-by-Step Guide to Identifying Server Bottlenecks
Finding the root cause requires a systematic approach involving monitoring, analysis, and testing.
Step 1: Establish Baselines and Monitor Key Metrics
You can’t identify deviations without knowing what’s normal. Start by establishing baseline performance metrics during periods of normal operation. Then, continuously monitor key indicators:
- CPU Usage: Track overall utilization, per-core usage, context switches, and load average (especially on Linux). Tools like Task Manager (Windows), Performance Monitor (Windows), `top`, `htop`, and `vmstat` (Linux) are invaluable.
- Memory Usage: Monitor total RAM usage, available memory, and swap/page file activity. High swap usage is often a clear sign of a memory bottleneck.
- Disk I/O: Look at disk read/write speeds, queue length (how many requests are waiting), and latency (how long requests take). Tools like Resource Monitor (Windows) and `iostat` (Linux) are useful here.
- Network Traffic: Monitor bandwidth utilization, latency (ping times), packet loss, and the number of connections. Use tools like `netstat`, `ss`, `ping`, and `traceroute`.
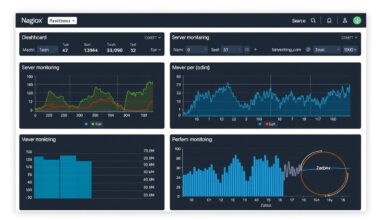
[Hint: Insert image/video of Performance Monitor or htop output showing key metrics here]
Step 2: Understand Your Workload
Context matters. What is the server *doing* when it slows down? Is it serving web requests, running database queries, processing batch jobs, or transcoding video? Understanding the specific workload helps correlate performance dips with specific activities.
Step 3: Execute, Observe, and Test
Don’t just monitor passively. Actively test the system:
- Simulate User Activity: Run typical user operations or application tasks while watching performance counters.
- Load Testing: Use tools (like ApacheBench, JMeter, k6) to simulate expected user load and see how the system scales.
- Stress Testing: Push the system beyond its expected limits to find its breaking point and identify the weakest link.
Step 4: Drill Down with Specific Tools
Generic tools provide an overview, but often you need specialized tools:
- Database Servers (SQL Server, MySQL, PostgreSQL): Use built-in query analyzers, performance dashboards (like SQL Server Activity Monitor), and profiling tools to find slow queries or inefficient database operations.
- Web Servers (Apache, Nginx): Analyze access logs and error logs. Enable performance monitoring modules if available.
- Application Profilers: For custom applications, use language-specific profilers to pinpoint slow functions or code sections.
Step 5: Consider the Ecosystem
Sometimes the bottleneck isn’t on the server itself. Investigate external factors:
- Network Infrastructure: Check switches, routers, firewalls, and overall network health between the server and its clients or dependencies.
- External Services: Is your server waiting excessively on responses from third-party APIs or other backend systems?
- Client-Side Issues: Ensure the performance problem isn’t originating from the user’s browser or device.
[Hint: Insert image/video illustrating a network monitoring tool graph showing latency or packet loss here]
Common Bottleneck Areas Explained
- CPU Bottleneck: The processor can’t keep up with computation demands. Symptoms include 100% CPU usage and high load averages. Often caused by inefficient code or too many processes competing for CPU time.
- Memory Bottleneck: Not enough RAM to hold active data and applications. Symptoms include excessive swapping/paging (writing memory data to disk) and potential Out-Of-Memory (OOM) errors.
- Disk I/O Bottleneck: Storage subsystem (HDDs, SSDs) cannot read/write data fast enough. Symptoms include high disk queue lengths, high disk active time, and slow application load times.
- Network Bottleneck: Network interface or infrastructure cannot handle the required data transfer rate. Symptoms include high latency, packet loss, and limited throughput below the interface’s theoretical maximum. Explore resources like the Linux Networking Documentation for deep dives.
Conclusion: Towards Optimized Performance
Effectively identifying server bottlenecks is a blend of monitoring, analysis, and methodical testing. By understanding the common symptoms, utilizing the right tools, and systematically investigating potential choke points across CPU, memory, disk, and network, you can pinpoint the root causes of poor performance. Remember that identification is just the first step. Once found, the next stage involves targeted tuning, resource upgrades, or configuration changes to alleviate the constraint and restore optimal server operation. Continuous monitoring is key to catching new bottlenecks as workloads evolve.
For next steps, consider exploring our guide on Specific Techniques for Resolving Common Server Bottlenecks.