Unlock Server Insights: A Systematic Approach to Reading Logs for Troubleshooting

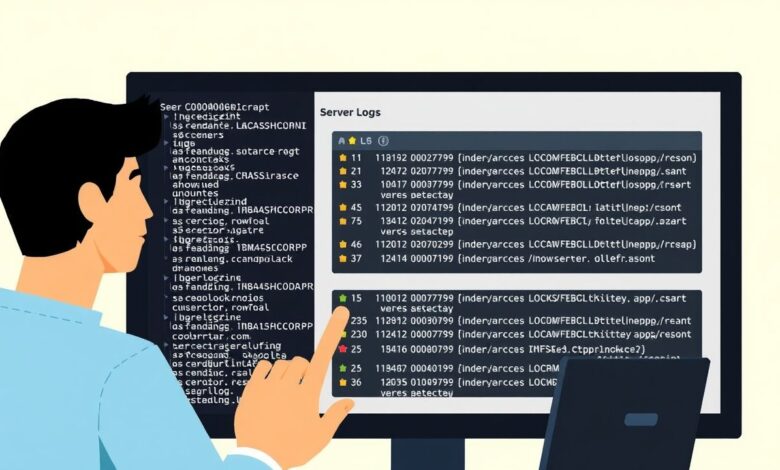
Server logs are the digital footprints of your system. They record everything from routine operations and user activity to critical errors and potential security breaches. For anyone managing servers, from beginners to experienced administrators, knowing how to read and interpret these logs is not just helpful – it’s absolutely essential for effective monitoring, robust security, and rapid troubleshooting. However, logs can be overwhelming. The sheer volume of data, the varied formats generated by different applications, and the cryptic nature of some entries can turn log analysis into a daunting task. This is where a systematic approach to reading server logs becomes your most valuable tool.
Why Server Logs Are Your Troubleshooting Superpower
Think of server logs as the black box recorder for your system. When something goes wrong – a service crashes, a website slows down, or unexpected behavior occurs – logs hold the clues needed to diagnose the problem and identify the root cause. They provide timestamps, process information, error codes, and descriptive messages that detail the sequence of events leading up to an issue. Without diving into the logs, you’re often left guessing, making troubleshooting a frustrating and time-consuming process.
Logs are also critical for:
- Monitoring system health and performance baselines.
- Detecting security incidents and unauthorized access attempts.
- Understanding user activity and application usage.
- Identifying resource bottlenecks.
- Performing post-mortem analysis after an outage.
The Log Overload Problem
The challenge isn’t the lack of information; it’s the *excess* of it. A busy server can generate gigabytes of log data daily. Manually sifting through countless lines across different log files (system logs, application logs, security logs, web server logs, database logs, etc.) is like finding a needle in a haystack – nearly impossible and incredibly inefficient.
Adding to the complexity, log formats aren’t always standardized across applications, although protocols like Syslog have emerged as a common standard for message logging, separating the message generation, storage, and analysis. Syslog messages themselves include structured components like a facility code (indicating the source type, e.g., kernel, mail system) and a severity level (ranging from Emergency to Debug). Understanding these components, even within a standardized format like Syslog, is key, but you still need a way to manage the volume and variety.
Without a plan, log analysis quickly becomes a “headache,” making it difficult to set a “pain threshold” to focus only on significant events rather than getting lost in the noise.
Adopting a Systematic Approach to Reading Server Logs
To turn log chaos into actionable insights, you need structure. Here’s a systematic approach:
Step 1: Know Your Logging Landscape
Before you can read logs effectively, you need to know where they are located and what kind of information they contain. On Linux systems, logs are often found in /var/log, with files like syslog, auth.log, kern.log, and specific application logs (e.g., Apache logs in /var/log/apache2 or /var/log/httpd). Windows servers use the Event Viewer, categorizing logs into System, Security, Application, and more.
Understand the common log formats for your key applications and services. Identify which logs are most likely to contain relevant information for different types of issues (e.g., security logs for failed logins, application logs for software errors).
[Hint: Insert image/video showing common log file locations on Linux and Windows Event Viewer]Step 2: Define Your Troubleshooting Goal
You’re rarely reading logs just for fun. You have a specific purpose – maybe investigating an application crash, diagnosing slow performance, or identifying a potential security breach. Clearly defining your goal helps you narrow down which logs to examine and what information to look for. Are you looking for error messages, warnings, specific timestamps, or messages originating from a particular process or service?
Step 3: Centralize and Aggregate Logs (Recommended)
Managing logs across multiple servers or applications is much easier with centralization. Tools that implement the Syslog protocol or dedicated log management systems collect logs from various sources into a single repository. This allows you to search and analyze logs from your entire infrastructure in one place, which is crucial for correlating events across different systems during complex troubleshooting.
Step 4: Filter the Noise
Once you know which logs are relevant and what you’re looking for, filter out irrelevant entries. This is where understanding log components like Syslog severity levels is vital. If you’re troubleshooting a critical issue, you might filter for ‘Error’, ‘Critical’, ‘Alert’, or ‘Emergency’ levels, ignoring ‘Informational’ or ‘Debug’ messages initially. You can also filter by time range, hostname, application name, or specific keywords related to your problem.
Step 5: Understand the Anatomy of a Log Entry
Each log entry tells a story. Learn to quickly identify the key pieces of information:
- Timestamp: When did the event occur? Crucial for tracing the sequence of events.
- Source/Hostname: Which server or device generated the log?
- Process/Application: Which software or service logged the message? (Corresponds to Syslog’s APP-NAME or PROCID).
- Severity/Level: How critical is the event? (e.g., Info, Warning, Error – see Syslog severity levels).
- The Message Content: This is the core information describing the event. It might include error codes, descriptions, user information, or system state details. (Corresponds to Syslog’s MSG).
Understanding these components allows you to quickly parse lines and extract the necessary context.
Step 6: Leverage Log Analysis Tools
Manual reading is rarely sufficient for complex environments. Various tools can dramatically simplify log analysis:
- Command-line utilities (Linux):
tail -ffor watching logs in real-time,grepfor searching for patterns or keywords,lessormorefor viewing large files, and combinations of these. Tools likeLogwatchcan provide daily summaries of log activity. - Windows Event Viewer: Provides built-in filtering and searching capabilities for Windows logs.
- Automated Log Analyzers/Management Systems: Commercial and open-source platforms (like the Elastic Stack, Splunk, Datadog, or simpler tools like NXLog and Rsyslog which conform to RFC 5424) offer advanced features like:
- Centralized collection (often via Syslog or agents).
- Parsing and structuring of diverse log formats.
- Powerful searching and filtering based on multiple criteria.
- Visualization through dashboards and graphs (e.g., errors per hour, login attempts per country).
- Alerting based on predefined patterns or thresholds.
Learning how to use these tools effectively, including configuring ignore rules for repetitive noise, is essential for focusing on truly relevant information.
Step 7: Correlate Events Across Logs
Issues are rarely confined to a single log file or a single server. An application error might be caused by a database issue logged elsewhere, or a performance problem could be linked to network errors on a different system. A systematic approach involves looking for related events across different log sources using timestamps and shared identifiers (like user IDs or transaction IDs) to build a complete picture of the problem.
Step 8: Document Your Findings and Solutions
When you successfully troubleshoot an issue using logs, document the process. Note which logs were helpful, what patterns or errors you found, and how you resolved the problem. This creates a knowledge base that will accelerate future troubleshooting efforts for similar issues.
The Benefits Are Clear
Adopting a systematic approach to reading server logs transforms a chaotic chore into an efficient diagnostic process. It enables you to identify issues faster, understand their root causes more accurately, improve security posture by spotting malicious activity, and ultimately maintain more stable and reliable server environments.
If you’re just starting out with servers, understanding the basics of where logs are and how to view them is crucial. We recommend checking out our guide on Understanding Server Logs: Where to Find Them and What They Mean to get familiar with the log files on your system.
Mastering log analysis takes practice, but by applying a systematic method and leveraging the right tools, you can unlock the valuable insights hidden within your server logs and become a more effective troubleshooter.
For further technical details on the Syslog standard, you can refer to the RFC 5424 specification.


