When it comes to running server applications, understanding their status is paramount. Are they alive? Are they healthy? These aren’t philosophical questions; they are critical for preventing downtime, ensuring a positive user experience, and ultimately, protecting your business’s bottom line. This is where basic health checks come into play. Implementing server health checks is a fundamental step in proactive server management.
Ignoring server and application health checks is like driving a car without a dashboard – you won’t know there’s a problem until it’s too late, potentially leading to costly breakdowns. Downtime, even for a few minutes, can translate into significant financial losses and severely damage user trust. By implementing robust health checks, you gain visibility and the ability to identify and address issues *before* they escalate and impact your users.
So, what exactly are server health checks? At their core, they are simple automated tests designed to verify that a server or application is functioning as expected. They provide a quick indication of status, typically a simple “healthy” or “unhealthy.” However, their simplicity belies their importance in detecting single points of failure and maintaining system reliability.
Why Basic Health Checks Are Essential
The benefits of implementing basic health checks are clear and compelling:
- Preventing Issues: Catching potential problems like resource exhaustion, failed dependencies, or unresponsive services early on.
- Avoiding Costly Downtime: Proactive identification prevents outages that can cost thousands per minute, depending on the scale of the business.
- Ensuring Business Success: Reliable applications are the backbone of modern digital businesses. Health checks contribute directly to this reliability.
- Improving Incident Response: When an issue does occur, health checks quickly pinpoint *which* part of the system is failing, speeding up diagnosis and resolution.
- Facilitating Automated Recovery: Many orchestration platforms (like Kubernetes) use health check results to automatically restart unhealthy instances, improving resilience.
Essentially, health checks provide the necessary feedback loop to understand if your servers are merely running or if they are truly *functioning* correctly from an application perspective.
Types of Server and Application Health Checks
Health checks can range from very simple to quite complex, depending on what you need to verify.
Simple Checks
The most basic check is often just hitting a specific URL endpoint (e.g., `/health` or `/status`) that returns a simple status code (like 200 OK) if the application process is running. This verifies the application is alive but doesn’t necessarily mean it’s fully functional.
Deeper Checks
More sophisticated health checks delve deeper, verifying essential dependencies. This might include:
- Checking database connections.
- Verifying connections to external APIs or services.
- Ensuring adequate disk space.
- Testing the responsiveness of key application functionalities.
These deeper checks provide a more accurate picture of the application’s overall health and ability to serve users. Properly assessing status requires understanding the critical components your application relies on.
[Hint: Insert image/video illustrating different types of health checks (e.g., simple ping vs. database check)]Implementing Basic Health Checks
The method for implementing health checks varies depending on your technology stack and infrastructure.
For web applications, creating a dedicated endpoint is common. In frameworks like ASP.NET Core, you can implement the `IHealthCheck` interface and the `CheckHealthAsync` method to define custom checks. For simpler web apps (like those built with ReactJS served by a backend), a basic status endpoint returning JSON can suffice.
Example (Conceptual Python Flask endpoint):
from flask import Flask, jsonify
app = Flask(__name__)
@app.route('/health')
def health_check():
    # Perform actual checks here (e.g., db connection, disk space)
    status = {"status": "healthy", "checks": {}}
    try:
        # Example: Check database connection (conceptual)
        # db.connection.ping()
        status["checks"]["database"] = "ok"
    except Exception as e:
        status["status"] = "unhealthy"
        status["checks"]["database"] = f"error: {e}"
# Example: Check disk space (conceptual)
    # if get_free_disk_space("/") < threshold:
    #     status["status"] = "unhealthy"
    #     status["checks"]["disk_space"] = "low"
    # else:
    #      status["checks"]["disk_space"] = "ok"
return jsonify(status), 200 if status["status"] == "healthy" else 503
if __name__ == '__main__':
    app.run(debug=True)
This conceptual example shows how an endpoint can check multiple components and report a detailed status. The HTTP status code (200 for healthy, 503 Service Unavailable for unhealthy) is crucial for monitoring tools.
In cloud environments like AWS, specific services and guides exist for implementing health checks, often integrated with load balancers or auto-scaling groups.
Regardless of the environment, a practical approach often involves a step-by-step process:
- Identify critical components/dependencies of your application.
- Design specific checks for each critical component.
- Implement the health check logic within your application or as a separate service.
- Expose the health check endpoint or mechanism.
- Integrate with a monitoring tool or platform.
Tools and Services for Monitoring Health Checks
While you can build custom health check endpoints, specialized tools and services make monitoring them much easier. These tools can periodically hit your health check endpoints and alert you when a check fails.
Examples include:
- Dedicated monitoring platforms (like Nagios, Zabbix, Prometheus + Alertmanager). You can learn more about these in our guide on Introduction to Server Monitoring Tools.
- Cloud provider monitoring services (AWS CloudWatch, Azure Monitor, Google Cloud Monitoring).
- Third-party monitoring services (like healthchecks.io, which is particularly useful for monitoring automated jobs and includes a self-hosted option).
- Load balancers often perform health checks to determine which server instances can receive traffic.
These tools don’t just tell you if a check failed; they can log the history, trigger alerts (email, SMS, Slack), and integrate with incident management workflows. For instance, a service like Pingdom or Uptime Robot provides external monitoring by hitting your public endpoints regularly.
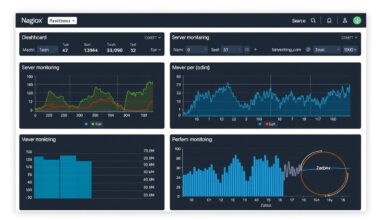
[Hint: Insert image/video showing a health monitoring dashboard]Best Practices for Basic Health Checks
To get the most out of your health checks, consider these best practices:
- Keep it Fast: Health checks should be quick to execute so they don’t add significant overhead or delay system responses.
- Make them Informative: While a simple healthy/unhealthy is okay, providing more detail (e.g., which dependency failed) is invaluable for troubleshooting.
- Check Critical Dependencies: Focus on the components that are essential for your application to function correctly.
- Don’t Overdo It: Too many complex checks can make the health check itself a performance bottleneck. Balance depth with speed.
- Integrate with Alerting: A health check that fails silently is useless. Ensure failures trigger notifications.
- Consider Performance and Security: While basic checks might not include deep performance tests, consider adding them for critical services. Ensure your health check endpoint is secure and doesn’t expose sensitive information.
- Use Appropriate HTTP Status Codes: Use 200 for healthy, and 5xx (like 503 Service Unavailable) for unhealthy states. This is standard and easily interpreted by monitoring tools.
Conclusion
Basic health checks for your server applications are not an optional luxury; they are a fundamental requirement for building resilient, reliable, and performant systems. By implementing simple yet effective checks, you gain crucial visibility into the operational status of your applications, enabling you to prevent failures, minimize downtime, and ensure a seamless experience for your users. Start with basic liveness checks and gradually add deeper readiness or dependency checks as needed. Integrating these checks with a monitoring solution will empower you to stay ahead of potential problems and keep your servers healthy.