Decoding Your Server: A Practical Guide to Interpreting Common Error Messages and Logs

Running a website or application often feels like smooth sailing, until suddenly, it isn’t. Users report issues, pages won’t load, and cryptic error messages appear. This is where understanding and interpreting server error logs becomes an indispensable skill. These logs are the black box recorder for your server, detailing every request, response, and critically, every error. Ignoring them is like ignoring your car’s check engine light – you might get away with it for a while, but eventually, it leads to bigger problems.
Effectively managing a server requires the ability to delve into its logs. This guide will walk you through the essentials of interpreting common server error messages and logs, empowering you to diagnose and fix issues faster.
Understanding the Language of Servers: HTTP Status Codes
Every time a browser or client interacts with your server, the server responds with an HTTP status code. These three-digit codes are categorized into classes:
- 2xx (Success): Everything is working as expected (e.g., 200 OK).
- 3xx (Redirection): The requested resource has moved (e.g., 301 Moved Permanently).
- 4xx (Client Errors): There’s an issue with the request itself, originating from the user’s side (e.g., bad syntax, requires authentication, resource not found).
- 5xx (Server Errors): The server failed to fulfill a valid request due to an internal issue.
While all codes provide information, troubleshooting primarily focuses on the 4xx and 5xx series, as these indicate problems preventing normal operation. Familiarizing yourself with common codes is the first step in interpreting server error logs.
[Hint: Insert image/video illustrating the different HTTP status code categories here]Common Client Errors (4xx) to Watch For:
- 400 Bad Request: The server couldn’t understand the request due to malformed syntax.
- 401 Unauthorized: Authentication is required and has failed or hasn’t been provided.
- 403 Forbidden: The server understood the request but refuses to authorize it. This often relates to file permissions or access rules (.htaccess).
- 404 Not Found: The classic error – the server cannot find the requested resource (file or page). This could be a typo in the URL, a deleted file, or a broken link.
Common Server Errors (5xx) Demystified:
- 500 Internal Server Error: This is a generic catch-all error indicating something went wrong on the server, but it couldn’t be more specific. Common causes include errors in scripts (PHP, Python, etc.), database connection issues, incorrect file permissions, or problems in the .htaccess file. This often requires digging into specific error logs.
- 502 Bad Gateway: Often seen in environments with reverse proxies or load balancers, this means one server acting as a gateway received an invalid response from an upstream server.
- 503 Service Unavailable: The server is temporarily unable to handle the request. This could be due to overloading (too much traffic), server maintenance, or resource exhaustion (CPU, RAM).
- 504 Gateway Timeout: Similar to 502, but specifically indicates that the gateway server didn’t receive a timely response from the upstream server it needed to access to complete the request.
For a comprehensive list, check out the official list of HTTP status codes on Wikipedia.
Diving into Server Logs: Access vs. Error
Servers typically maintain two main types of logs:
- Access Logs: Record every request made to the server. They show who requested what, when, the status code returned, and the size of the response. Useful for tracking traffic patterns and identifying valid requests that might be causing issues indirectly.
- Error Logs: Specifically record events classified as errors. This is your primary resource when troubleshooting 4xx and 5xx status codes or other server-side malfunctions. They often contain detailed messages about *what* went wrong and *where* (e.g., specific script file and line number).
Knowing where to find these logs is crucial. Common locations on Linux systems include `/var/log/apache2/` (for Apache), `/var/log/nginx/` (for Nginx), or `/var/log/httpd/`. On Windows servers, errors are often logged in the Windows Event Viewer under Application or System logs.
How to Start Interpreting Server Error Logs
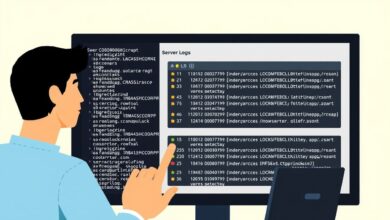
Log entries can look intimidating initially, but they usually follow a standard format. A typical error log entry might include:
- Timestamp: When the error occurred.
- Log Level/Severity: Indicates the seriousness (e.g., ERROR, WARN, INFO, DEBUG). You’ll often focus on ERROR or CRITICAL levels.
- Process ID (PID): The specific server process that handled the request.
- Client Information: Often the IP address of the user making the request.
- Error Message: The core description of the problem. This is the part that needs interpretation.
Example (Simplified Apache Error):
[Tue Nov 21 10:35:02.123456 2023] [:error] [pid 12345] [client 192.168.1.101:54321] PHP Parse error: syntax error, unexpected '}' in /var/www/html/my_script.php on line 55
This tells us: The exact time, it’s an error (`:error`), the process ID, the client IP, and the specific issue – a PHP syntax error in `my_script.php` on line 55.
[Hint: Insert image/video showing an example server error log entry highlighted]Tools for Log Management and Analysis
Manually sifting through large log files is inefficient. Several tools can help:
- Linux Command Line: Tools like `tail -f error.log` (view logs live), `grep “Error Message” error.log` (search for specific errors), and `less error.log` (page through logs) are essential.
- Logwatch (Linux): A utility that parses logs and generates a summary report, often delivered via email. It’s configurable to filter noise and focus on important events.
- Windows Event Viewer: The standard tool on Windows Server for viewing system, security, and application logs. It allows filtering and searching. Windows errors often point towards hardware issues, driver problems, memory faults, or corrupted system files.
- Log Management Systems: For larger setups, dedicated systems like Elasticsearch/Logstash/Kibana (ELK Stack), Graylog, or Splunk provide powerful aggregation, searching, and visualization capabilities.
For more tips on server maintenance, check out our related article on essential server health checks.
Troubleshooting Common Issues Using Logs
When faced with a server issue, follow these steps:
- Identify the Time: Note when the issue started or when users reported it.
- Check the Logs: Look at the error logs around that specific time.
- Filter Noise: Focus on entries with severity levels like ERROR, CRITICAL, or WARNING.
- Isolate Specific Errors: Look for recurring error messages or those directly related to the reported problem (e.g., PHP errors for a broken script, database errors for connection issues).
- Research the Error: Copy and paste specific error messages into a search engine. Often, others have encountered and solved the same issue.
- Correlate with Access Logs: Check if specific requests in the access log correspond temporally with errors in the error log.
- Check System Resources: Sometimes errors (like 503) are caused by resource exhaustion. Check CPU, RAM, and disk usage.
Conclusion: Logs Are Your Friend
Server error messages and logs might seem complex, but they are invaluable diagnostic tools. Taking the time to learn how to locate, read, and interpret them transforms troubleshooting from guesswork into a methodical process. By understanding HTTP status codes, differentiating between log types, using appropriate tools, and systematically analyzing error messages, you can significantly reduce downtime and keep your server running smoothly. Proactive log monitoring is key to identifying potential problems before they impact your users, making interpreting server error logs a fundamental skill for any server administrator or website owner.


