Mastering High Disk I/O Wait Diagnosis on Linux Servers

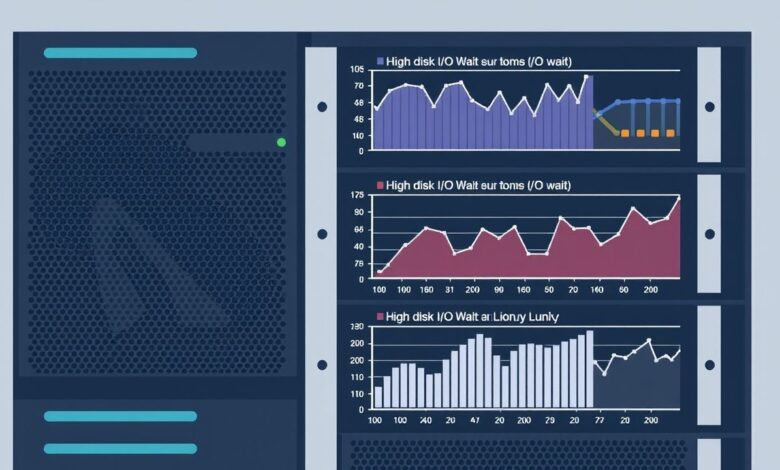
High disk I/O wait is a performance killer for Linux servers. When your CPU spends a significant amount of time idle, waiting for input/output operations (primarily disk reads and writes) to complete, you’re experiencing I/O wait. Diagnosing high disk I/O wait on Linux servers is crucial for maintaining system responsiveness and stability. This state indicates that processes are ready to run but are stalled, blocked by slow or overloaded storage resources.
Understanding I/O wait is the first step. A high `%wa` (wait) percentage reported by system monitoring tools signifies that the CPU isn’t the bottleneck; the storage subsystem likely is. While disk activity is the most common cause, network I/O can also contribute, especially in scenarios involving network-attached storage (NAS) or heavy network file system (NFS) usage.
Several factors can lead to excessive I/O wait:
-
Slow or Failing Hardware: Aging hard drives, misconfigured RAID arrays, or issues with storage controllers can drastically slow down I/O operations.
[Hint: Insert image/video explaining RAID levels and their impact on performance] -
Application Behavior: Certain applications, like databases performing complex queries, logging systems writing large volumes of data, or backup processes, can generate intense I/O loads.
-
Inefficient Configuration: Incorrect filesystem choices, suboptimal database tuning, or poor application design can exacerbate I/O demands.
-
Excessive Swapping: When a system runs out of physical RAM, it starts using swap space on the disk, leading to a significant increase in disk I/O. You can learn more about swap in Linux and Windows here.
Fortunately, Linux provides a robust set of tools to help you pinpoint the source of high I/O wait. Mastering these utilities is key to effective diagnosis.
The Linux I/O Diagnostic Toolbox
Several command-line tools are indispensable when investigating I/O wait issues. Each offers a different perspective on system activity.
Understanding the Big Picture with `top` and `vmstat`
The `top` command provides a dynamic, real-time view of your system. Look for the `%wa` metric in the CPU usage summary at the top of the output. A consistently high value here is your primary indicator of an I/O wait problem. Additionally, observe the process list. While `top` primarily focuses on CPU usage, it can sometimes show processes in an uninterruptible sleep state (often denoted by ‘D’ in the ‘S’ column), which typically means they are waiting for I/O to complete.
The `vmstat` command reports virtual memory statistics but also provides valuable I/O insights. When run with an interval (e.g., `vmstat 1`), it shows real-time system activity. Pay close attention to the `wa` column under the `cpu` section. This number reflects the percentage of CPU time spent waiting for I/O.
The Power of `iostat` for Disk Activity
For detailed disk performance analysis, `iostat` is the premier tool. Part of the `sysstat` package, `iostat` provides in-depth statistics about device utilization.
Run `iostat -xz 1` to get extended statistics for all devices every second. Key metrics to watch include:
-
`%util` : Percentage of time the device is busy with I/O requests. Values close to 100% indicate a bottleneck.
-
`r/s` and `w/s` : Reads and writes per second.
-
`rMB/s` and `wMB/s` : Read and written megabytes per second.
-
`await` : The average time (in milliseconds) that requests issued to the device take to be served. This includes the time spent by the requests in the queue and the time spent servicing them.
-
`svctm` : The average service time (in milliseconds) for requests issued to the device. (Note: `svctm` can be unreliable on modern kernels and `await` is often preferred).
High `%util` coupled with high `await` is a strong indicator of a disk bottleneck. Comparing `r/s` and `w/s` with `rMB/s` and `wMB/s` can help determine if the bottleneck is due to a high number of small operations or a few large transfers. For more details, consult the iostat man page.
Identifying Culprit Processes with `iotop`
While `iostat` shows which *devices* are busy, `iotop` shows which *processes* are generating the most I/O. This tool presents a `top`-like interface specifically focused on I/O activity per process.
Running `iotop` (often requires `sudo`) shows a list of processes ordered by their current disk I/O usage. This is invaluable for quickly identifying the specific application or command hammering your storage subsystem.
Historical Analysis with `sar`
The `sar` command (System Activity Reporter), also part of the `sysstat` package, allows you to collect and report system activity over time. This is particularly useful for diagnosing intermittent I/O issues or analyzing trends.
You can view historical I/O statistics using `sar -dp` (for disk I/O statistics) or `sar -B` (for paging/swapping statistics) for a specific day’s data file, usually located in `/var/log/sa/`. Analyzing `sar` output helps determine when I/O wait started occurring and what other system metrics (like CPU or memory usage) were doing concurrently.
Interpreting Your Findings
Once you’ve gathered data from these tools, correlate the information:
-
Does `top` show high `%wa`? Confirm with `vmstat`.
-
Which device is busiest according to `iostat` (`%util` close to 100%)? Is it a specific physical disk, a RAID device (like `md0`), or a logical volume (`vg-data-lv`)?
-
Which process is generating the most read/write activity according to `iotop`? Is it a database server, a backup script, a development process, or something unexpected?
-
Did the I/O wait start at a specific time or occur periodically, as shown by `sar`?
By connecting the “what” (high I/O wait), the “where” (the device), and the “who” (the process), you can narrow down the root cause.
Potential Solutions
Based on your diagnosis, solutions might include:
-
Hardware Upgrade/Replacement: If a disk is failing or simply too slow for the workload, upgrading to faster drives (SSDs are significantly faster for random I/O) or a more capable storage array might be necessary.
-
Storage Configuration Optimization: Ensure your RAID level is appropriate for the workload (RAID 10 often provides better performance than RAID 5 for mixed read/write workloads). Check disk alignment.
-
Application Tuning: Optimize database queries, adjust application logging levels, or reschedule intensive I/O tasks (like backups) to off-peak hours.
-
Increase RAM: If excessive swapping is the cause, adding more RAM will alleviate disk pressure.
-
Filesystem Tuning: Consider filesystem-specific tuning options or migrating to a filesystem better suited for the workload (e.g., XFS for large files and directories).
Conclusion
High disk I/O wait is a clear signal that your Linux server’s storage is struggling to keep up. By systematically using tools like `top`, `vmstat`, `iostat`, `iotop`, and `sar`, you can effectively diagnose the source of the bottleneck, whether it’s hardware, software, or configuration related. Pinpointing the cause is the critical step towards implementing the right solution and restoring your server’s performance. Regular monitoring of server resource usage, including I/O, is a best practice to catch these issues early.


