Mastering Linux: How to Effectively Troubleshoot High CPU Usage on Your Servers

Experiencing sluggish performance or unresponsiveness on your Linux server? High CPU usage is a common culprit, drastically impacting your system’s ability to handle tasks efficiently. Learning how to troubleshoot high CPU usage Linux environments is a critical skill for any system administrator or developer. This guide will walk you through identifying the causes and implementing effective solutions using standard Linux tools.
High CPU utilization means the central processing unit (CPU) is working at or near its maximum capacity, leaving little room for new processes or requests. While temporary spikes during demanding tasks are normal, sustained high CPU usage points to an underlying problem that needs investigation. Ignoring it can lead to application failures, timeouts, and a frustrating user experience.
Identifying the Problem: Initial Steps to Troubleshoot High CPU Usage Linux
The first step is always observation. Before diving deep, get a real-time overview of your system’s resource consumption. Several powerful command-line utilities are built into most Linux distributions for this exact purpose.
Using the `top` Command
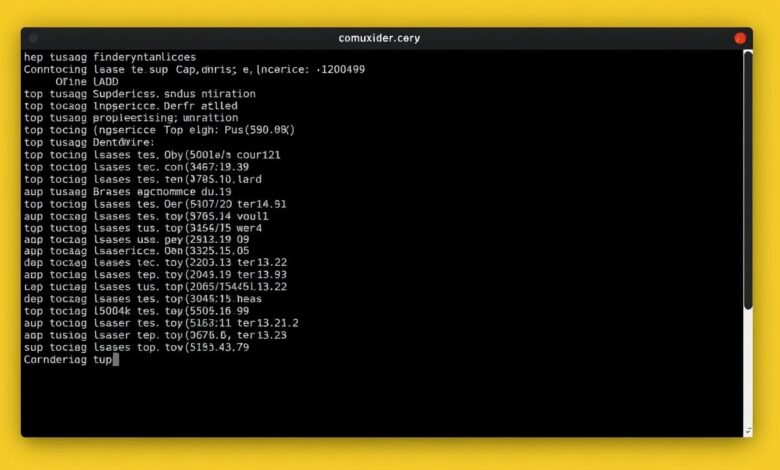
The `top` command is a fundamental tool for real-time system monitoring. Simply type `top` in your terminal and press Enter. It provides a dynamic view of running processes, ordered by CPU usage by default.
Key columns to watch in `top`:
- %CPU: Shows the percentage of CPU time a process is consuming. This is usually the most important column for diagnosing high CPU usage.
- PID: The Process ID, useful for targeting a specific process for further action.
- USER: The owner of the process.
- COMMAND: The name of the command or program running.
- %MEM: Memory usage, which can sometimes correlate with high CPU issues.
- us, sy, ni, id, wa, hi, si, st: These fields in the summary header show CPU time distribution (user, system, nice, idle, I/O wait, hardware interrupts, software interrupts, steal time). High `us` or `sy` indicates application or kernel activity, while high `wa` suggests I/O bottlenecks might be impacting performance.
Press ‘q’ to exit `top`.
`[Hint: Insert image/video of top command output showing high CPU usage here]`
Leveraging `htop`: A More User-Friendly Alternative
`htop` is an enhanced, interactive process viewer. If not installed, you can usually add it using your package manager (e.g., `sudo apt install htop` or `sudo yum install htop`).
`htop` offers several advantages over `top`:
- Color-coded display for better readability.
- Easier scrolling through the process list (vertically and horizontally).
- Ability to easily sort processes by clicking column headers (or using function keys).
- Tree view (press F5) to see process hierarchies.
- Direct process interaction (e.g., killing processes with F9).
`htop` makes it significantly easier to visualize and manage processes contributing to high CPU load.
`[Hint: Insert image/video of htop interface highlighting sorting and killing features here]`
Other Useful Commands for Diagnosis
While `top` and `htop` are often sufficient, other commands provide complementary information:
`ps` Command
The `ps` command can provide a snapshot of current processes. To list processes sorted by CPU usage, you can use:
ps aux --sort=-%cpu | head
This command shows all processes (`aux`), sorts them in descending order by CPU percentage (`–sort=-%cpu`), and displays the top few (`head`).
`vmstat` Command
`vmstat` (Virtual Memory Statistics) provides a broader overview of system activity, including processes, memory, paging, block IO, traps, and CPU activity. Running `vmstat 1` will give you updates every second.
Pay attention to:
- r (run queue): Number of processes waiting for run time. A consistently high number indicates CPU saturation.
- cs (context switches): High context switching can indicate inefficient processing or too many active threads.
- us, sy, id, wa, st: CPU time percentages similar to `top`.
Analyzing and Resolving the High CPU Usage
Once you’ve identified the process(es) consuming excessive CPU using tools like `top` or `htop`, the next step is analysis and action.
Common Causes for High CPU Usage
- Runaway Processes: Bugs in applications can cause them to enter infinite loops or consume excessive resources.
- Heavy Applications: Databases, web servers under heavy load, encoding tasks, or complex computations naturally require significant CPU power.
- Insufficient Resources: The server might simply be undersized for its workload.
- I/O Bottlenecks: Processes waiting for slow disk or network I/O (`%wa` in `top`) can sometimes keep the CPU busy managing waits, although the CPU itself isn’t doing computational work.
- Kernel Processes/Interrupts: High system time (`sy` in `top`) might indicate issues with kernel modules or excessive hardware interrupts.
- Poorly Optimized Code/Queries: Inefficient application code or database queries can lead to unnecessary CPU churn.
Steps to Fix High CPU Load
- Kill or Restart the Process: If a specific application process is misbehaving (e.g., a runaway script), the quickest fix is often to terminate it. Use the PID found with `top` or `htop`.
- `kill PID` (sends SIGTERM, allowing graceful shutdown)
- `kill -9 PID` or `kill -SIGKILL PID` (forces termination, use cautiously)
- `pkill process_name`
- `killall process_name`
After killing, monitor if the issue returns. If it does, further investigation into the application itself is needed.
- Optimize the Application: If a legitimate application is constantly using high CPU, look for optimization opportunities. This might involve code refactoring, database query tuning, or adjusting application configuration settings.
- Check System Updates: Ensure your Linux kernel, drivers, and application software are up-to-date. Patches often include performance improvements and bug fixes that could resolve CPU issues.
- Investigate I/O Wait: If `%wa` is high, focus on diagnosing disk or network performance issues. Tools like `iotop`, `iostat`, and `nethogs` can help. Read more about disk performance here.
- Increase Resources: If the server is consistently overloaded due to legitimate workload, upgrading hardware (more CPU cores, faster CPUs) or scaling up your cloud instance might be the only solution.
- Check Resource Limits: Ensure user or process resource limits (`ulimit`) aren’t artificially constraining performance in unexpected ways.
- Consider Process Priority: Use `nice` or `renice` to lower the priority of CPU-intensive, non-critical background tasks, freeing up CPU for more important processes.
Conclusion: Proactive Monitoring is Key
Successfully troubleshooting high CPU usage on Linux servers involves systematic identification using tools like `top`, `htop`, and `ps`, followed by targeted analysis and remediation. Remember that high CPU isn’t always bad if it’s due to productive work, but sustained, unexpected high load requires attention.
Regular monitoring and understanding your system’s baseline performance are crucial for quickly detecting and resolving issues before they significantly impact users or services. For more in-depth analysis techniques, consider exploring tools like `perf` and `strace` for profiling application behavior. You can find extensive documentation on many of these tools within the Linux man pages.


