Mastering Server Management: A Guide to Navigating the Windows Server Manager Dashboard
For IT administrators managing Windows Server environments, efficiency and visibility are paramount. The cornerstone of this management is often the Server Manager, and specifically, mastering navigating the Windows Server Manager Dashboard is crucial for staying on top of server health, performance, and configuration. This central console, introduced with Windows Server 2008 and significantly revamped in Server 2012, provides a comprehensive overview and launchpad for various administrative tasks across local and remote servers.
Understanding the layout and functionality of the Server Manager Dashboard allows administrators to quickly assess the state of their infrastructure, identify potential issues, and streamline routine management operations. Let’s dive into how you can effectively navigate this powerful tool.
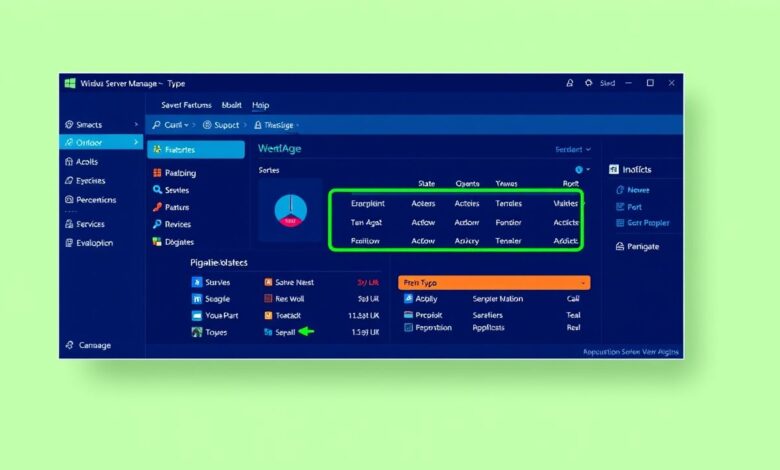
[Hint: Insert image/video of the main Windows Server Manager Dashboard interface here]What is the Windows Server Manager Dashboard?
The Server Manager Dashboard serves as the default landing page when you launch Server Manager. Think of it as your command center for server administration. It aggregates critical information from all the servers you’ve added to the Server Manager pool, presenting a high-level overview at a glance. This is distinct from the simpler “Windows Server Essentials Dashboard” found in Essentials editions, though some functionalities might overlap.
Its primary purpose is to:
- Display the manageability status of local and remote servers.
- Show alerts and notifications related to events, services, performance, and Best Practice Analyzer (BPA) results.
- Provide quick access to tools for configuring roles, features, and server groups.
- Summarize installed roles and features across managed servers.
Key Components for Navigating the Windows Server Manager Dashboard
Effectively navigating the Windows Server Manager Dashboard involves understanding its main sections or “tiles”:
1. Welcome Tile
Typically shows quick start options like adding servers, creating server groups, or adding roles and features. It’s a helpful starting point for initial configurations or common tasks.
2. Roles and Server Groups Tile
This tile provides a consolidated view of the roles installed across your managed servers. Servers are often grouped by the roles they perform (e.g., File and Storage Services, IIS, Active Directory Domain Services). Clicking on a role here usually navigates you to a dedicated page for managing servers running that specific role.
- You can see status indicators (Green = OK, Red = Critical Alert, Yellow = Warning).
- Events, Services, Performance counters, and BPA results specific to that role group are often displayed.
3. Servers Tile (or Local Server/All Servers)
Depending on your context (viewing the main dashboard or a specific role/group), you’ll see a tile listing the servers being managed. The “All Servers” group contains every server added to Server Manager. Selecting a server in this list often تpopulates other tiles (Events, Services, Performance, etc.) with data specific to that server.
[Hint: Insert image focusing on the ‘Servers’ tile and server status indicators]Understanding Status and Alerts
A major part of navigating the Windows Server Manager Dashboard efficiently is interpreting the status indicators and alerts.
Events Tile
This tile aggregates critical, error, and warning events from the System logs of your managed servers. It’s a critical area for troubleshooting. You can:
- Filter events by severity, time period, source, or server.
- Click on an event to view its details.
- Launch Event Viewer directly from tasks associated with this tile.
Services Tile
Monitors the status of important services across managed servers. It flags services that are stopped but set to start automatically. Administrators can quickly start, stop, or restart services directly from this tile’s context menu.
Performance Tile
Provides alerts based on predefined CPU and memory usage thresholds. If a server consistently exceeds these thresholds, Performance alerts will appear here, indicating potential bottlenecks. You can configure alert thresholds for more tailored monitoring.
Best Practices Analyzer (BPA) Tile
Displays results from BPA scans run against specific roles. BPA compares your server configuration against Microsoft’s recommended best practices, highlighting potential configuration issues or deviations.
Adding Servers and Expanding Management
The Dashboard isn’t just for viewing; it’s a starting point for action. You can easily add other Windows Servers (physical or virtual) to manage them remotely:
- Go to the Manage menu → Add Servers.
- Find servers via Active Directory, DNS, or by importing a list.
- Once added, they appear in the “All Servers” group and relevant Role groups.
This multi-server management capability is a core strength, allowing you to deploy roles like Remote Desktop Services or manage features across multiple machines from one console. For a deeper dive into server roles, check the official Microsoft Learn documentation on Server Manager.
Customization and Efficiency
To refine your view, create custom Server Groups (Manage → Create Server Group). Grouping servers logically (e.g., by location, function, or OS version) makes navigating the Windows Server Manager Dashboard even more targeted and less overwhelming, especially in larger environments.
For further insights into optimizing server setups, you might find related information useful on managing server configurations effectively here.
Conclusion
The Windows Server Manager Dashboard is an indispensable tool for modern Windows Server administration. By understanding its layout, interpreting the status indicators, and utilizing its management capabilities, IT professionals can significantly improve their efficiency. Taking the time to master navigating the Windows Server Manager Dashboard allows for quicker troubleshooting, streamlined configuration, and better overall visibility into the health and performance of your server infrastructure. While newer tools like Windows Admin Center offer web-based alternatives, Server Manager remains a robust and widely used console for day-to-day server management.