Step-by-Step Guide: How to Troubleshoot High Memory Usage on Windows Servers

Is your Windows Server sluggish, unresponsive, or even crashing? One of the most common culprits behind performance degradation is excessively high memory usage on Windows Server environments. When physical RAM (Random Access Memory) runs low, the system starts relying heavily on the much slower page file (disk storage), leading to significant bottlenecks. This guide provides a comprehensive approach to diagnosing and resolving high memory utilization on Windows Server 2016, 2019, and newer versions, whether physical or virtual.
Understanding why your server is consuming so much memory is the first critical step. It’s not always a rogue application; sometimes, it’s the operating system’s caching mechanisms or even a problematic driver. Let’s dive into the common causes and the tools you need to identify them.
Why Worry About High Memory Usage?
RAM is essential for quick access to data the processor needs. When available memory dwindles:
- Applications slow down as data is swapped to disk (paging).
- Server responsiveness degrades, affecting user experience.
- System instability increases, potentially leading to crashes.
- Troubleshooting other issues becomes harder as performance is already compromised.
Consistently seeing memory usage above 80-90% without a clear reason warrants investigation.
Common Causes of High Memory Usage on Windows Server
Several factors can contribute to excessive RAM consumption:
1. Application Demand
This is the most straightforward cause. Running memory-intensive applications (like databases, web servers, virtualization platforms) or simply too many applications simultaneously can naturally consume available RAM. Check if the load matches the server’s specifications.
2. File System Caching
Windows uses available RAM to cache frequently accessed files, significantly speeding up disk I/O. This is often seen on file servers. While technically “available” memory (it can be released if needed), Task Manager might misleadingly show high usage. Tools like RAMMap are needed to differentiate cache usage from active application memory.
3. Memory Leaks (Applications or Drivers)
A memory leak occurs when a process requests memory but fails to release it back to the OS when it’s no longer needed. Over time, this slowly consumes available RAM until the system becomes unstable. Leaks can happen in user-mode applications or kernel-mode drivers.
4. Problematic Drivers
Beyond leaks, some drivers might inefficiently allocate large chunks of memory from the system’s memory pools (Paged or Non-Paged Pool). This is harder to spot without specialized tools like Poolmon.
5. Windows Updates
Occasionally, specific Windows updates have been identified as causing unexpected increases in memory usage. Keeping an eye on update release notes and community forums can be helpful.
6. Misconfiguration or Leftover Processes
Sometimes, monitoring tools (`perfmon`, `procmon`) left running accidentally, or misconfigured service settings, can consume significant resources.
7. Virtual Machine Guest Issues
In virtualized environments (like Hyper-V or VMware), outdated or missing guest integration services or VM drivers (e.g., VirtIO drivers for KVM) can lead to inaccurate memory reporting or inefficient usage within the guest OS.
Essential Tools for Diagnosing High Memory Usage
Windows provides built-in and downloadable tools to pinpoint the source of memory pressure:
1. Task Manager
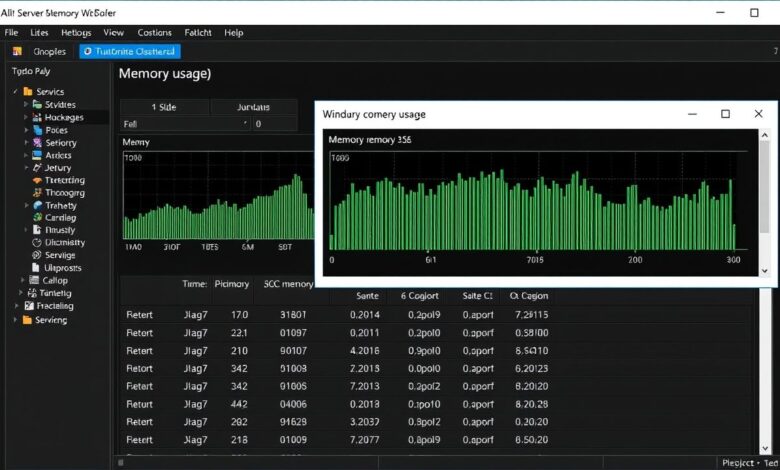
Your first stop (Ctrl+Shift+Esc). Look at the Processes and Performance tabs. While useful for a quick overview of application memory usage, it doesn’t always clearly show memory used by the file cache or driver pools.
`[Hint: Insert image of Task Manager Performance Tab showing Memory usage here]`
2. Resource Monitor (Resmon.exe)
A more detailed view than Task Manager. Launch it from Task Manager’s Performance tab or by searching “resmon”. The Memory tab breaks down usage into Hardware Reserved, In Use, Modified, Standby, and Free. Pay attention to the ‘Standby’ list – high usage here often indicates heavy file caching. You can also see per-process commit and working set sizes.
`[Hint: Insert image of Resource Monitor Memory Tab breakdown here]`
3. Sysinternals RAMMap
An invaluable free tool from Microsoft (download here). RAMMap provides the most detailed breakdown of how physical memory is being used, clearly showing active process memory, driver allocations, mapped files, and the crucial file summary/standby list (system cache). It’s excellent for identifying if high usage is due to caching vs. active processes.
`[Hint: Insert video demonstrating RAMMap usage to identify cache vs process memory here]`
4. Performance Monitor (Perfmon.exe)
Perfmon allows logging memory counters over time to identify trends or spikes related to specific events or applications. Key counters include:
- Memory\Available MBytes
- Memory\Committed Bytes
- Memory\Commit Limit
- Memory\Pool Paged Bytes
- Memory\Pool Nonpaged Bytes
- Process(Instance)\Working Set
- Process(Instance)\Private Bytes
Logging these can help correlate memory growth with specific process activity.
5. PoolMon (Memory Pool Monitor)
Part of the Windows Driver Kit (WDK), Poolmon is essential for diagnosing memory pool leaks caused by drivers. It displays allocations tagged by drivers, allowing you to identify which driver tag is consuming excessive Paged or Non-Paged pool memory. You then match the tag to the specific driver file.
Step-by-Step Troubleshooting Strategy
Step 1: Basic Checks
- Restart the Server: A simple reboot can temporarily clear memory leaks or reset caching, but it doesn’t fix the underlying cause.
- Check Recent Changes: Did the high usage start after installing new software, updating drivers, or applying Windows Updates?
Step 2: Initial Diagnosis (Task Manager & Resource Monitor)
- Use Task Manager to identify processes with high memory usage (Working Set).
- Use Resource Monitor to check the overall memory composition. Is ‘Standby’ memory very high? This points towards file caching. Is ‘In Use’ memory genuinely high? Focus on processes.
Step 3: Deep Dive with RAMMap
- Run RAMMap to confirm the memory distribution. If ‘Mapped File’ or ‘Metafile’ (under File Summary) is high, it’s likely file system caching, especially on file servers. This is often normal behaviour but can be managed if problematic (see below).
- If ‘Process Private’, ‘Paged Pool’, or ‘Nonpaged Pool’ are consuming the majority, focus your investigation there.
`[Hint: Insert image comparing RAMMap output for cache-heavy vs process-heavy scenarios here]`
Step 4: Investigate Specific Causes
- High Application Usage: If a specific process (SQL Server, IIS worker process, etc.) is the culprit, investigate its configuration, workload, or potential leaks within the application itself. Consider optimizing the application or providing more resources if the usage is legitimate.
- High File Cache Usage: This is often normal. However, if it impacts performance severely, investigate using tools like RAMMap. Sometimes, applications that could benefit from direct I/O aren’t configured correctly. Consider exploring options like limiting the cache size (advanced, use with caution) or ensuring applications use appropriate file access flags.
- Suspected Driver Leak/Usage (High Pool Allocation): Use Poolmon. Sort by bytes (‘B’ key) to find tags consuming large amounts of Paged or Non-Paged Pool memory. Note the tag name. Use `findstr /s
*.sys` in `C:\Windows\System32\drivers` to identify the driver file associated with the tag. Update or troubleshoot that specific driver. - VM Guest Issues: Ensure the latest guest integration services or VM tools are installed and running correctly within the virtual machine.
Step 5: Implement Solutions
- Update/Rollback Drivers/Software: If a specific driver or application is identified, check for updates or known issues. Rolling back a recent update might be necessary.
- Optimize System/Applications: Review application settings, limit unnecessary services or startup programs.
- Address Caching: If file caching is problematic, consult application documentation for settings like “Unbuffered disk IO” where applicable.
- Schedule Regular Reboots: While not a fix for leaks, regular reboots can be a mitigation strategy for systems prone to slow memory leakage until the root cause is fixed.
- Consult Internal Resources: Check related performance tuning guides. For example, see our guide on general Windows Server performance tuning.
When to Consider Adding More RAM
If, after thorough investigation, you determine that the memory usage is legitimate—required by the applications and workload running on the server—and performance is suffering, the only solution might be to increase the physical RAM installed in the server.
Conclusion
Troubleshooting high memory usage on Windows Server requires a methodical approach. Start with basic tools like Task Manager and Resource Monitor, then escalate to specialized tools like RAMMap and Poolmon as needed. By systematically identifying whether the cause is application demand, aggressive caching, or a memory leak from software or drivers, you can take targeted actions to restore server performance and stability. Regular monitoring and proactive maintenance are key to preventing memory issues from impacting your critical server infrastructure.


