In the world of servers and applications, logs are the breadcrumbs that tell us what’s happening under the hood. They record events, errors, and status messages, providing invaluable insights into system behavior. While reviewing historical logs is essential for post-mortem analysis, sometimes you need to see what’s happening *right now*. This is where real-time log monitoring comes into play, and one of the most classic, straightforward methods, especially on Linux and Unix-like systems, is using the tail -f command.
Watching logs live, often referred to as “Live Tail,” allows you to observe new log entries as they are generated. This capability is crucial for:
- Quickly troubleshooting issues as they occur.
- Debugging applications during development or testing.
- Monitoring system activity for suspicious patterns.
- Seeing the immediate results of configuration changes.
Whether you’re working with simple application logs, system journals, or web server access logs, seeing the data stream live provides an immediate feedback loop that static log files cannot match.
What is tail -f?
The tail command is a standard utility in Unix-like operating systems used to display the last lines of a file. By default, it shows the final 10 lines. However, its real power for live monitoring comes from the -f option. The -f flag stands for “follow”. When you use tail -f [filename], the command doesn’t just show you the last few lines and exit; it continues to monitor the file. As new lines are written to the file by another process, tail -f automatically displays them to your terminal.
This creates a live, streaming view of the log file, making it an indispensable tool for anyone managing servers or applications. It’s a simple yet incredibly effective way to keep an eye on activity without needing complex monitoring software.
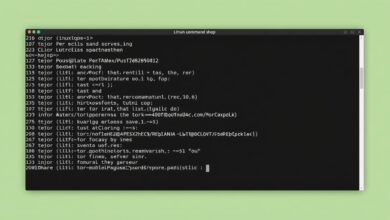
[Hint: Insert image/video showing a terminal withtail -f actively displaying log lines]
Basic Usage of tail -f
Using tail -f is incredibly simple. You just need to know the path to the log file you want to monitor. Open your terminal and type:
tail -f /path/to/your/logfile.logReplace /path/to/your/logfile.log with the actual path to the log file you wish to watch. For example, to watch the Apache access log on many Linux systems, you might use:
tail -f /var/log/apache2/access.logOr for system messages:
tail -f /var/log/syslogThe output will immediately show the last few lines of the file (usually 10) and then wait. As new entries are appended to logfile.log, they will appear in your terminal window in real time.
To stop the tail -f command and return to your command prompt, simply press Ctrl + C.
Combining tail -f with Other Command-Line Tools
While tail -f is powerful on its own, its true flexibility shines when combined with other standard Unix command-line utilities, particularly grep. grep is used to search for patterns within text. By piping the output of tail -f to grep, you can filter the live log stream to only show lines that match a specific keyword or pattern.
tail -f /path/to/your/logfile.log | grep "error"This command will only display lines from the log file that contain the word “error”. This is extremely useful for focusing on specific types of events or messages.
You can also use grep with options like --color=auto to highlight the matching text, making it even easier to spot relevant entries:
tail -f /path/to/your/logfile.log | grep --color=auto "warning"For more complex filtering, you can use regular expressions with grep or chain multiple grep commands using pipes.
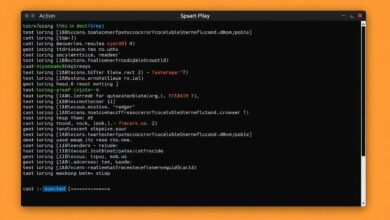
tail -f | grep filtering a log stream]
Limitations of tail -f and When to Look Further
While simple and effective for basic use cases, tail -f does have limitations, especially compared to dedicated log management platforms. The provided information highlights that platforms like Datadog, New Relic, Google Cloud Logging, and AWS CloudWatch Logs offer advanced “Live Tail” features with significantly more capabilities:
- Centralized Viewing: Dedicated platforms can live tail logs from multiple servers and applications simultaneously, from anywhere in your infrastructure.
tail -ftypically works on a single file on a single machine at a time (unless combined with SSH and scripting). - Search and Filtering: While you can combine with
grep, dedicated tools often have powerful, indexed search and filtering capabilities that are much faster and more flexible, sometimes allowing searches across live and recent historical data (e.g., last 15 minutes). - Correlation: Platforms can correlate log data with other monitoring data, such as application performance metrics or infrastructure metrics.
- Visibility: They can provide visibility into various log types and sometimes include features like viewing unsampled logs or getting live statistics.
- Accessibility: Dedicated tools are accessible via web interfaces, CLIs, and APIs, offering more ways to interact with the live stream.
So, while `tail -f` is excellent for checking a specific log file on a server you are currently connected to, for distributed systems, complex filtering, long-term monitoring, or correlating logs with other metrics, dedicated log management solutions are necessary.
However, for many day-to-day tasks, quick checks, and debugging on a single machine, tail -f remains an invaluable, readily available tool. Its simplicity is its strength.
Beyond Basic `tail -f`
Beyond the simple `tail -f` and `grep` combination, you can explore scripting to monitor multiple files or trigger actions based on log output. Tools like watch can also be used in conjunction with `tail` (though `tail -f` is usually preferred for simple following) or other commands to repeatedly execute them and observe changes.
Understanding how to locate and interpret server logs is a fundamental skill. For more on finding and understanding logs in general, check out our article on Understanding Server Logs: Where to Find Them and What They Mean.
The ability to watch logs live, whether through the classic `tail -f` command or advanced platform features, dramatically speeds up the process of identifying and resolving issues. It turns static records into a dynamic stream of information, providing immediate visibility into the heartbeat of your systems.
For further technical details on the tail command and its options, you can consult the official manual page: tail(1) – Linux manual page.
Conclusion
Watching logs live using tail -f is a fundamental skill for system administrators, developers, and anyone troubleshooting issues on Unix-like systems. Its simplicity and immediate feedback make it perfect for quick checks and debugging. While enterprise-level log management platforms offer more sophisticated real-time monitoring capabilities, understanding and utilizing tail -f provides a solid foundation for interacting with log data and remains a go-to command for direct server access. Master this simple command, and you’ll gain a powerful window into the live activity of your systems.